Appearance
Dashboards & Widgets
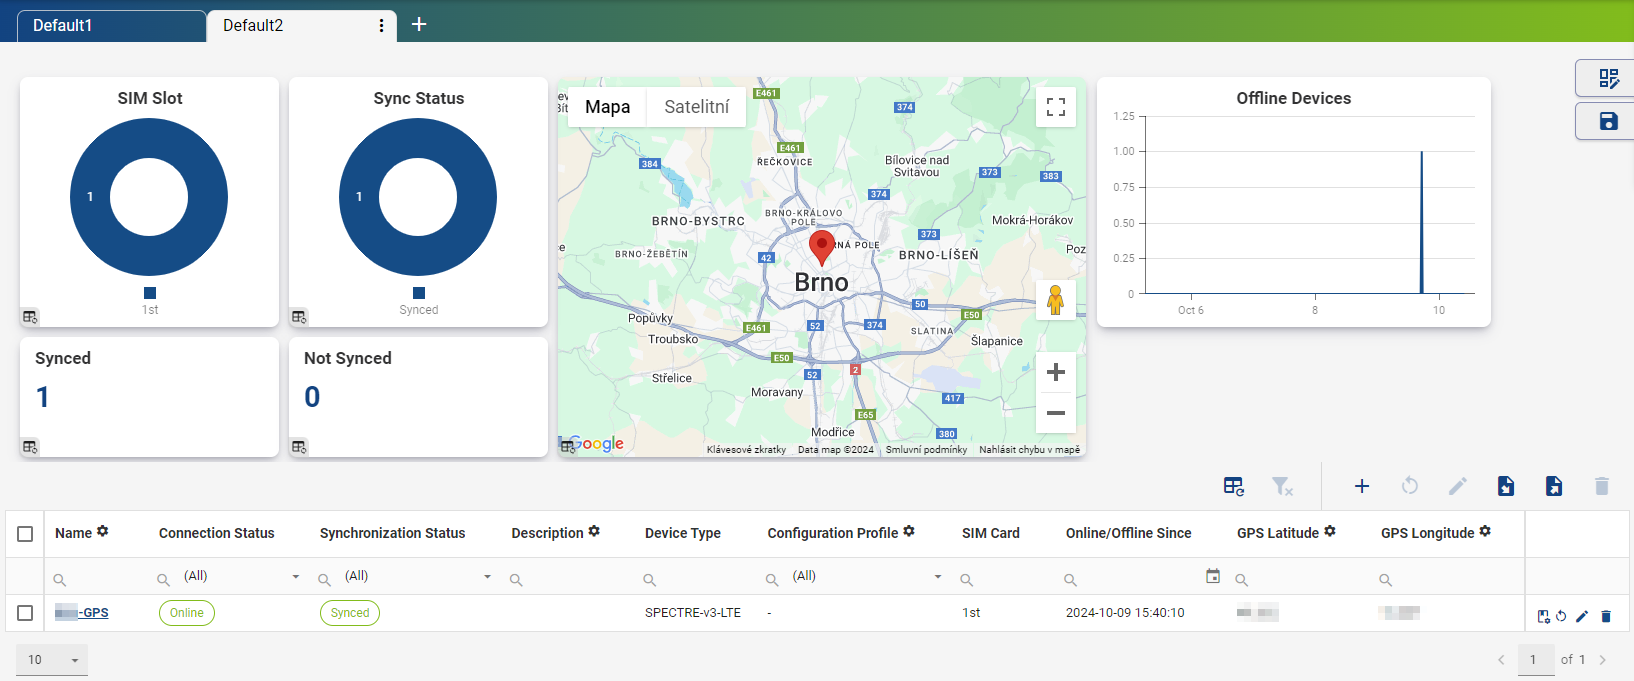
On the Dashboard home page, you can create multiple views, which appear as tabs at the top of the page. Each view can contain different widgets such as charts, stats, and tables. You can also apply filters and save them as part of the view.
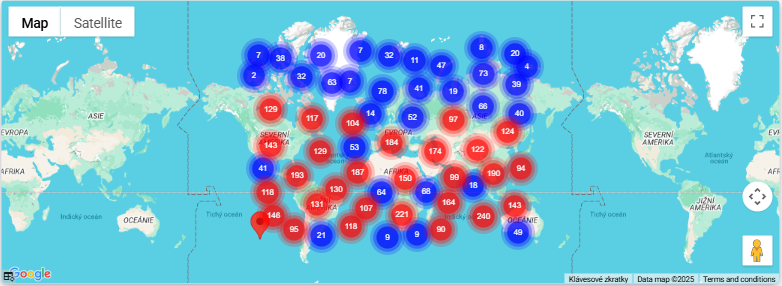
When managing a large number of devices, the map widget automatically groups devices into location clusters to improve readability.
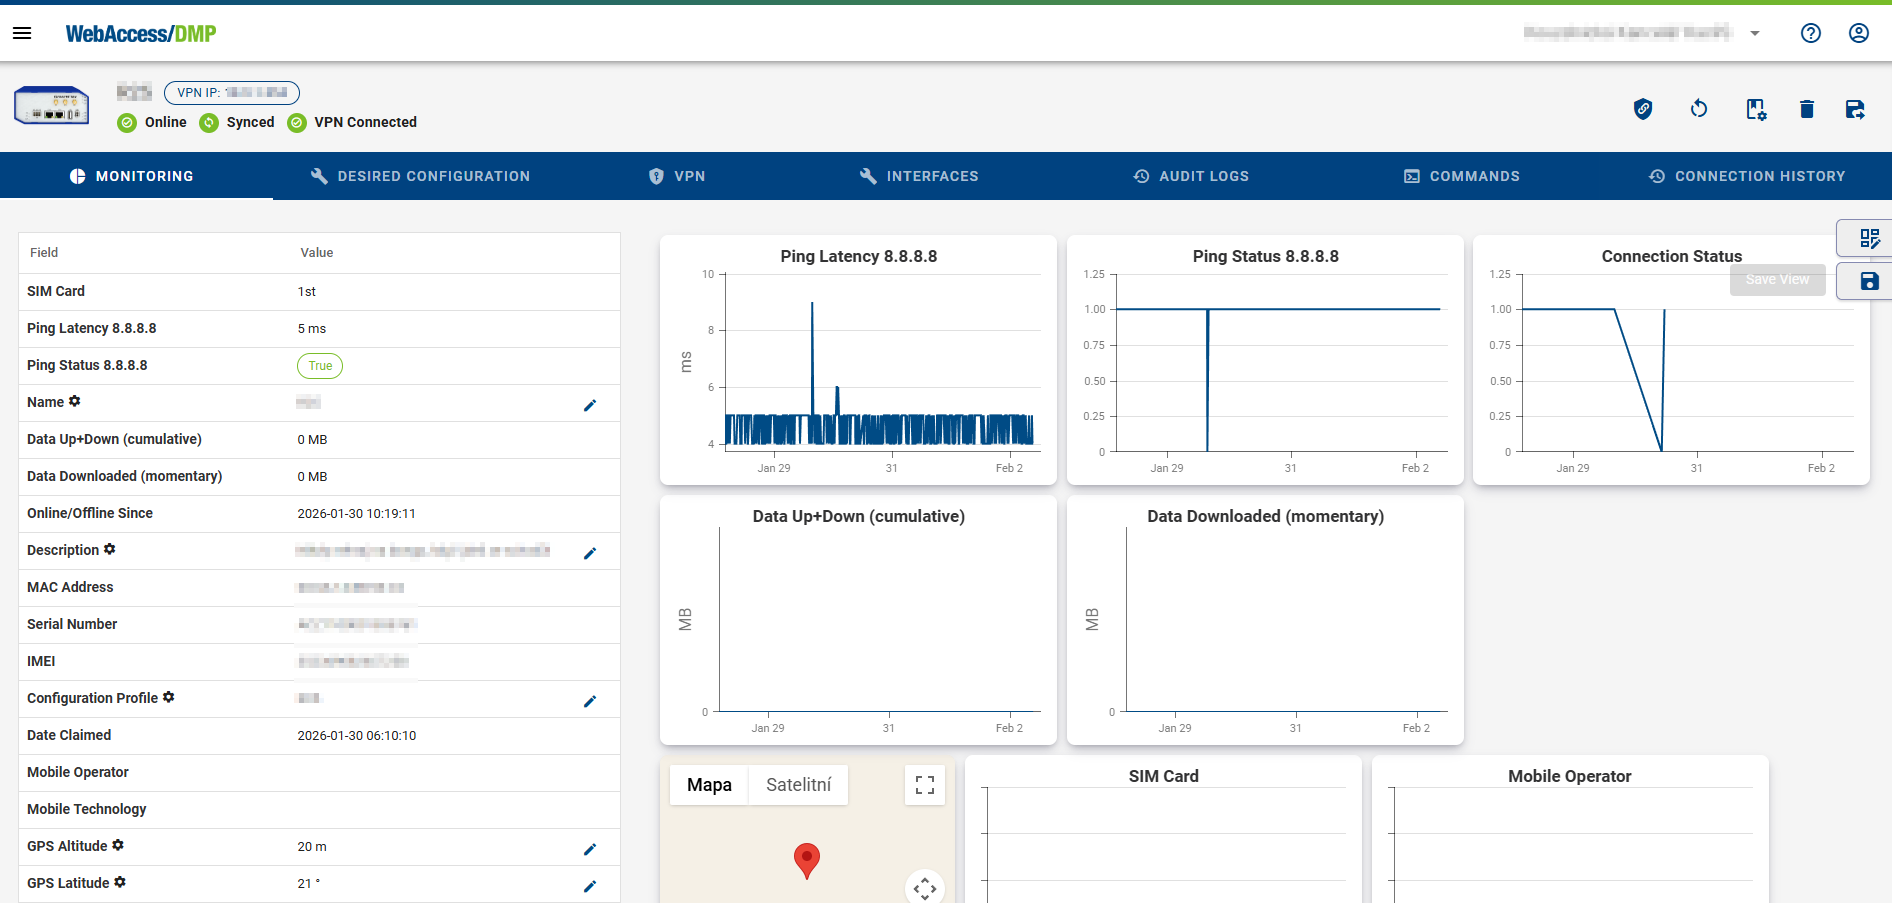
On the Device Detail page, a similar dashboard is available under the Monitoring tab. Here, you can:
- Add Fields as columns in the table
- Add charts and statistics widgets
The layout of this device-level dashboard is shared across all devices within the company. It acts as a template, defining which information is shown whenever any device detail page is opened.