
Appearance
Customization of Views
The Company Dashboard (home page) allows you to create multiple views, while the Device Dashboard lets you customize views for individual devices in a similar way.
Structure of the Company Dashboard
The dashboard UI is divided into four main areas:
.DJYq56FV.png)
A: Title Panel
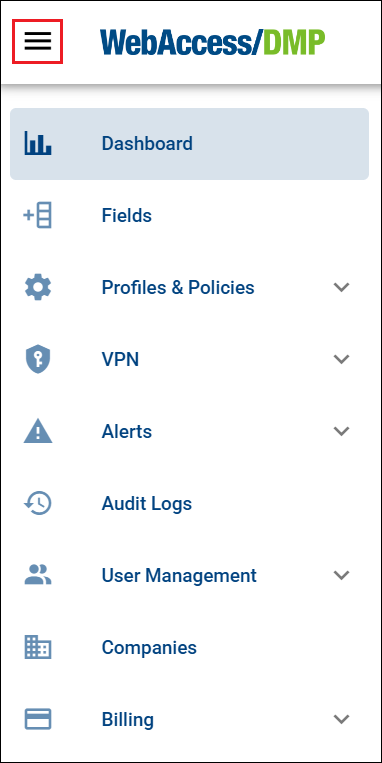
The Title Panel contains a link to the Context Panel, where you can define what is displayed in Panel C.
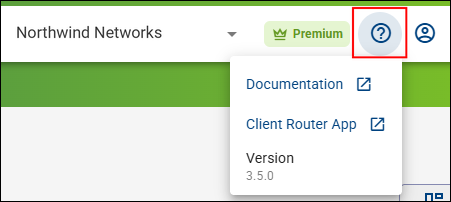
It also provides access to:
- Documentation
- Client Router App
- Application version
- Information about the currently logged-in user
B: Views Panel
This panel allows you to create new views or select existing ones, which define the layout and content of Panels C and D.
.CdPcvRpB.png)
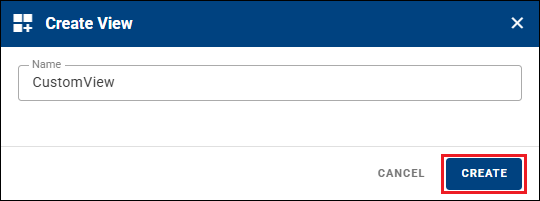
To create a new view:
- Click the + icon.
- Enter a name for the view.
- Click Create.
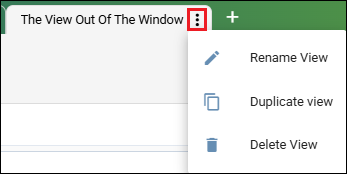
To edit, duplicate, or delete a view, click the three-dots icon next to the view name.
C: Details Panel
This is the main content area of the dashboard. The information displayed here depends on the selected view and the applied filters.
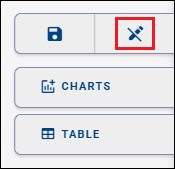
Click the icon at the top of the panel to enter Edit View mode.
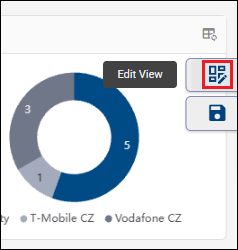
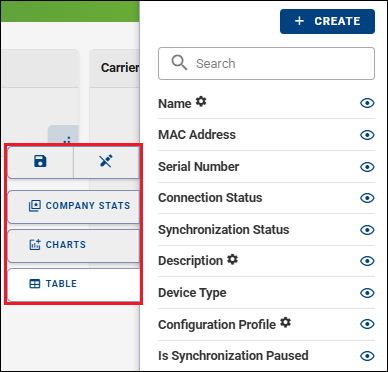
In Edit View mode, you can:
- Add or remove widgets (Company Stats, Charts, Tables).
- Reorder and resize widgets.
- Configure table columns.
Click the Floppy Disk icon to save the current view.
D: Filter Panel
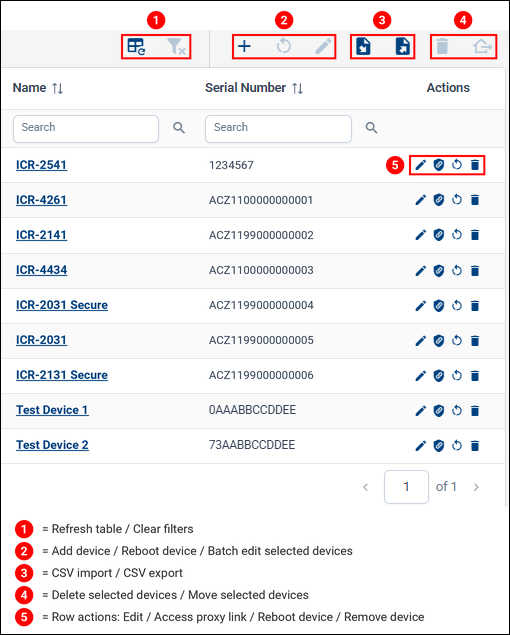
The Filter Panel allows you to:
When there are online or offline devices, aggregated company data is displayed:
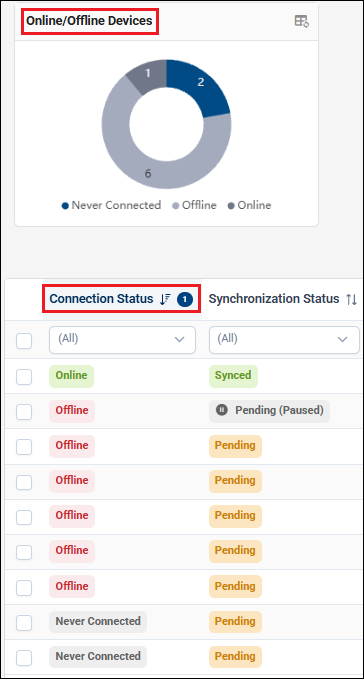
For detailed descriptions of the available fields, see Fields.
Searching and Filtering
You can search, filter, and sort devices freely. These actions apply only to the currently active view.
Searching for a Specific Device
- Select the column you want to search.
- Enter the desired value.
Example — searching for devices containing "ICR-283x" in the Device Type column:

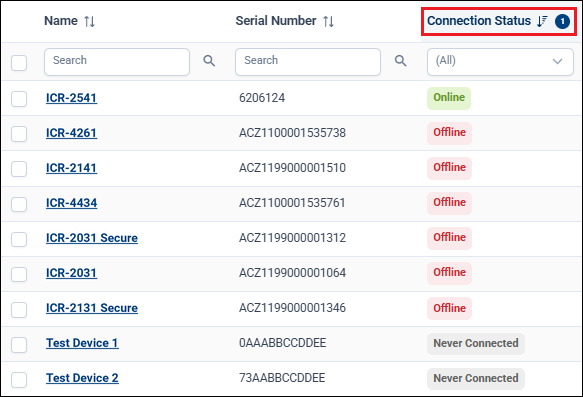
Sorting Devices
To sort devices by a column (for example, Connection Status):
- Click the column header.
- Select ascending or descending order.
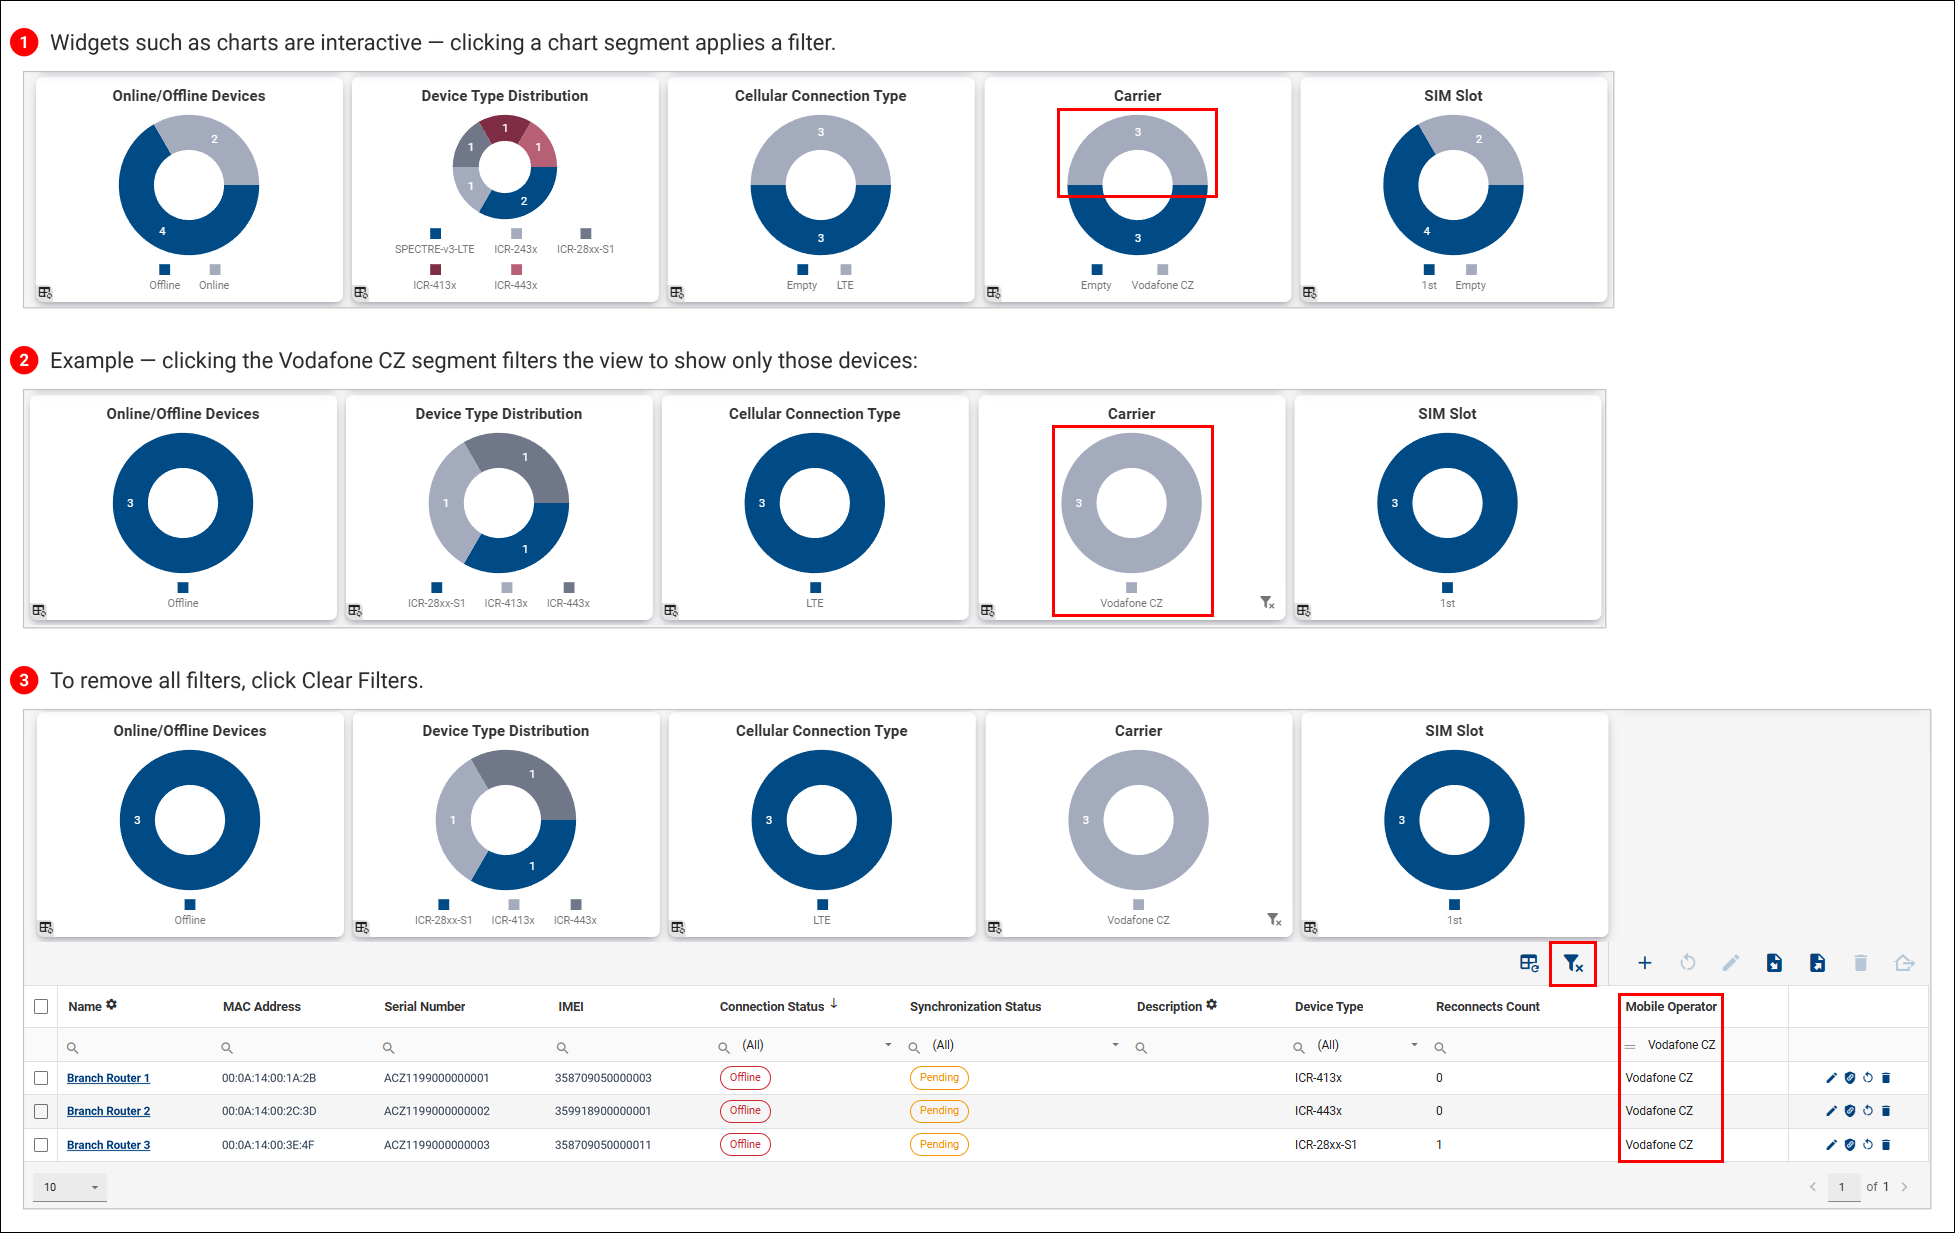
Filtering Using Widgets
- Widgets such as charts are interactive — clicking a chart segment applies a filter.
- Example — clicking the Vodafone CZ segment filters the view to show only those devices.
- To remove all filters, click Clear Filters.
Device Dashboard
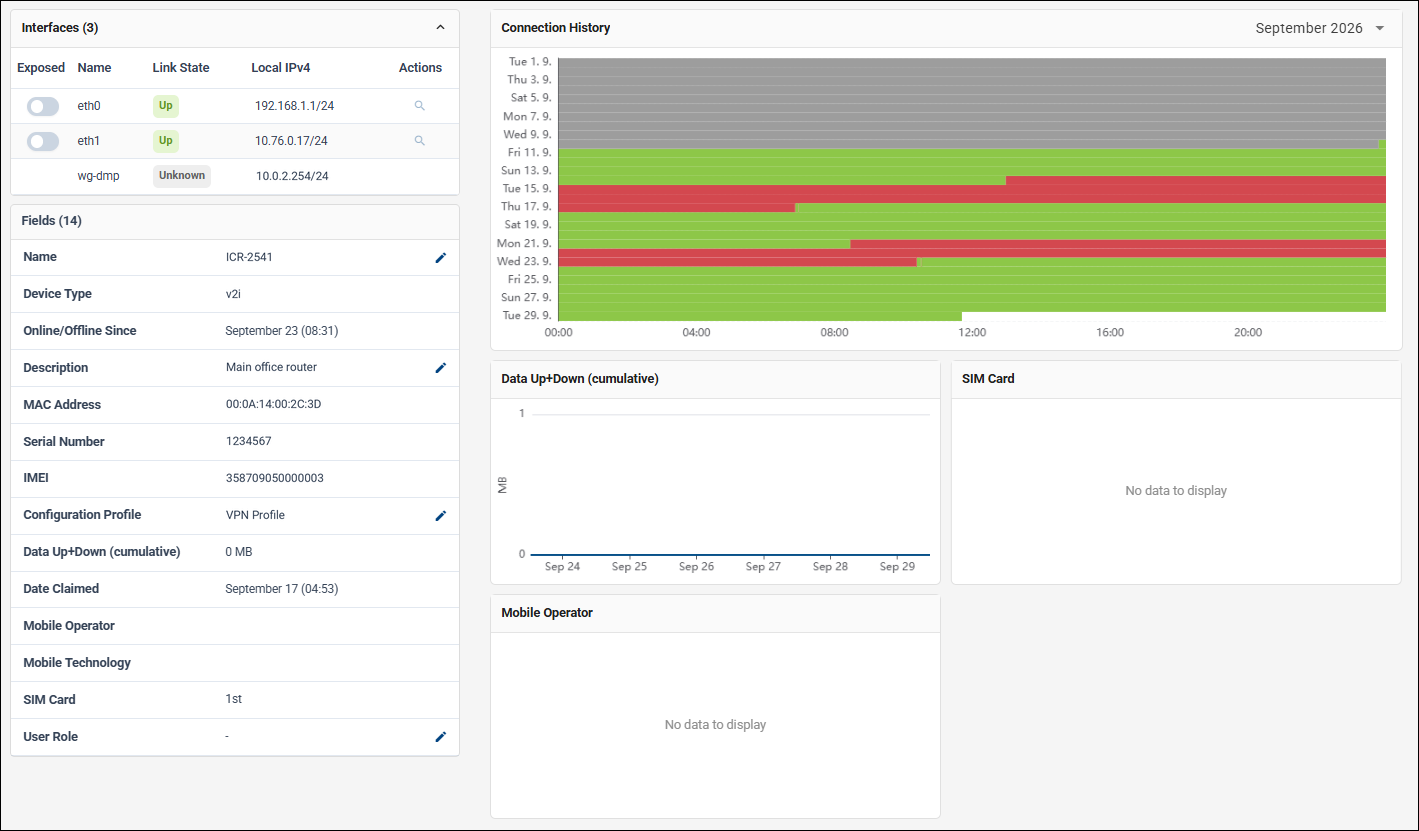
To open a device dashboard, go to the Dashboard and select the device by clicking its name in the Filter Panel.
Note
When viewing a device for the first time, the dashboard may be empty if no monitoring data is available yet.
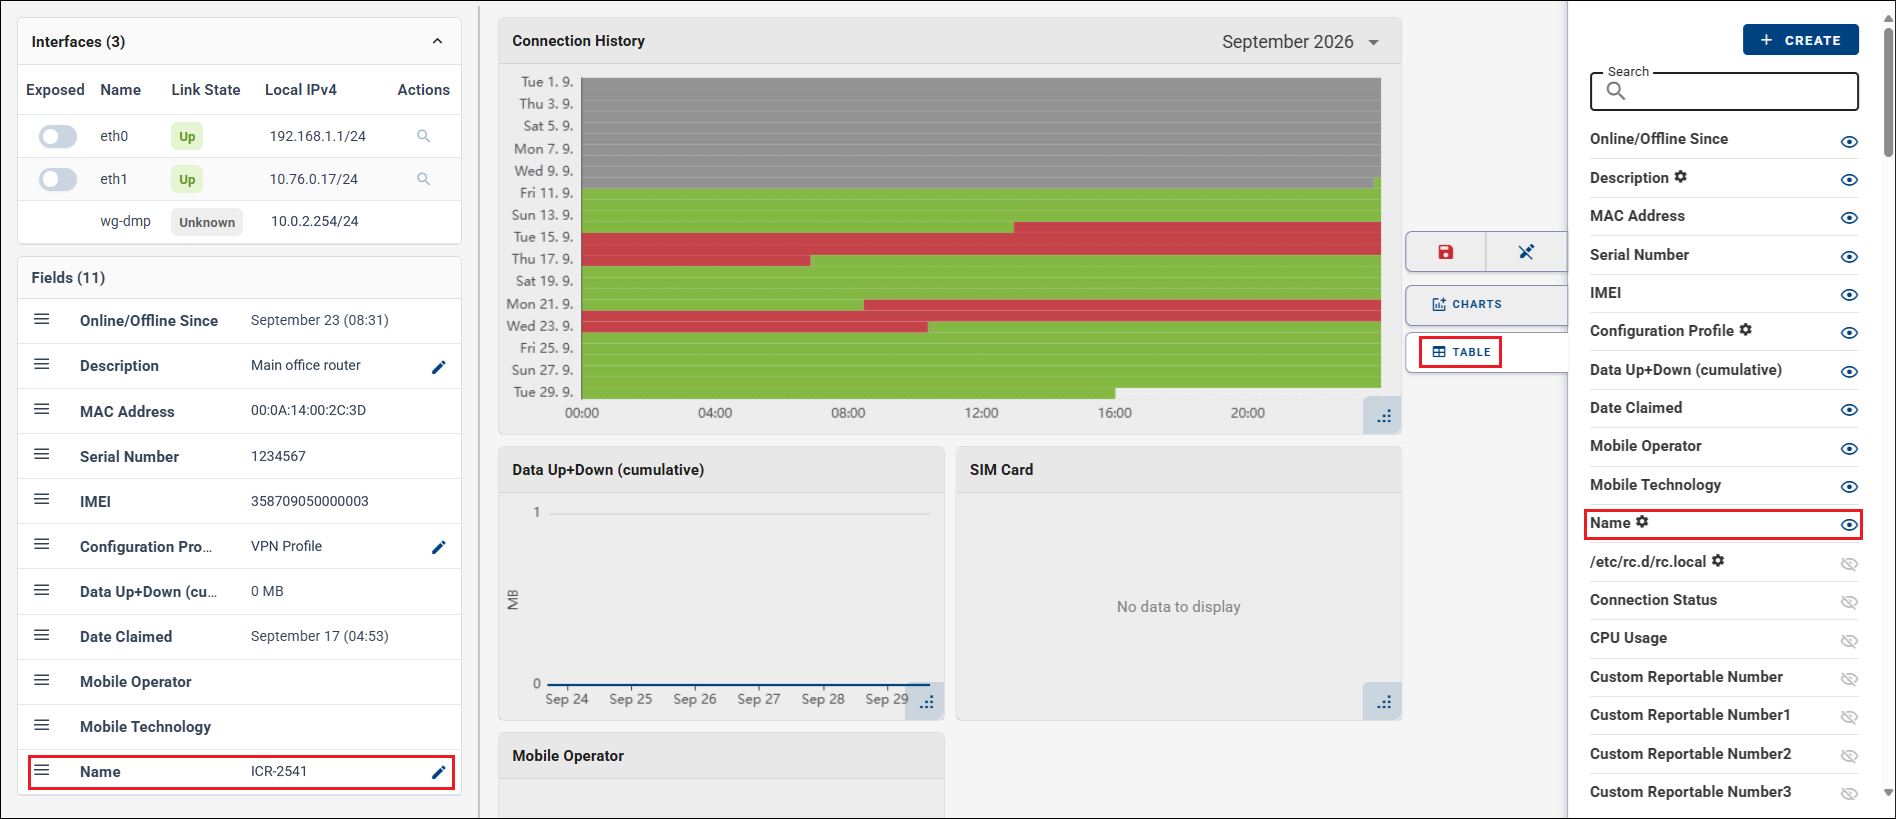
The example below shows the monitoring dashboard for an individual device, including charts, tables, and key status indicators.
To customize the device dashboard, click Edit View.
To add tables:
- Open Edit View.
- Enable Table.
- Add fields using + CREATE.
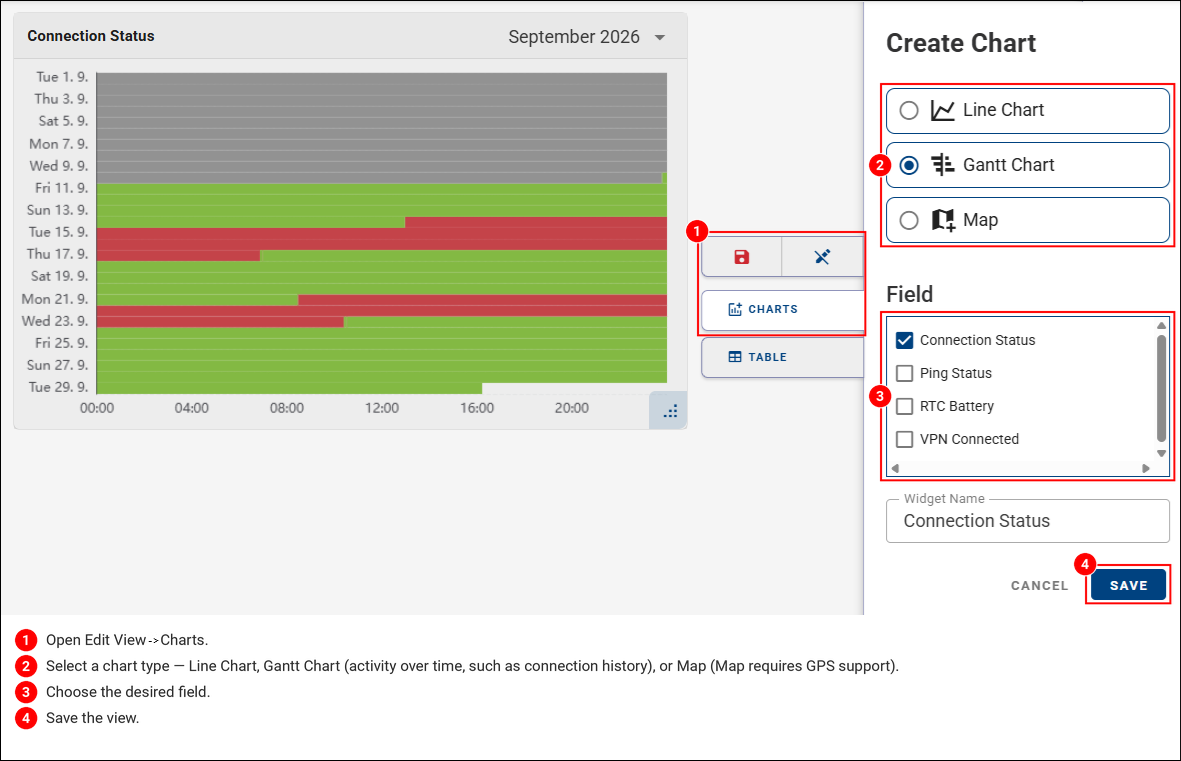
To add charts:
- Open Edit View → Charts.
- Select a chart type — Line Chart, Gantt Chart (activity over time, such as connection history), or Map (Map requires GPS support).
- Choose the desired field.
- Save the view.
Note
Any changes made in Edit View mode must be saved using the Floppy Disk icon.